2022 Consumer
Texting Behavior
Report
Introduction
The competition among businesses and organizations to attract consumer attention is more intense than ever, as the number of traditional and digital communication channels grow.
Text marketing, with its unrivaled 98% open rate, continues to deliver phenomenal results by helping businesses and organizations drive ecommerce efforts, streamline reminders and notifications, build brand awareness, and create opportunities to directly engage with their contacts.
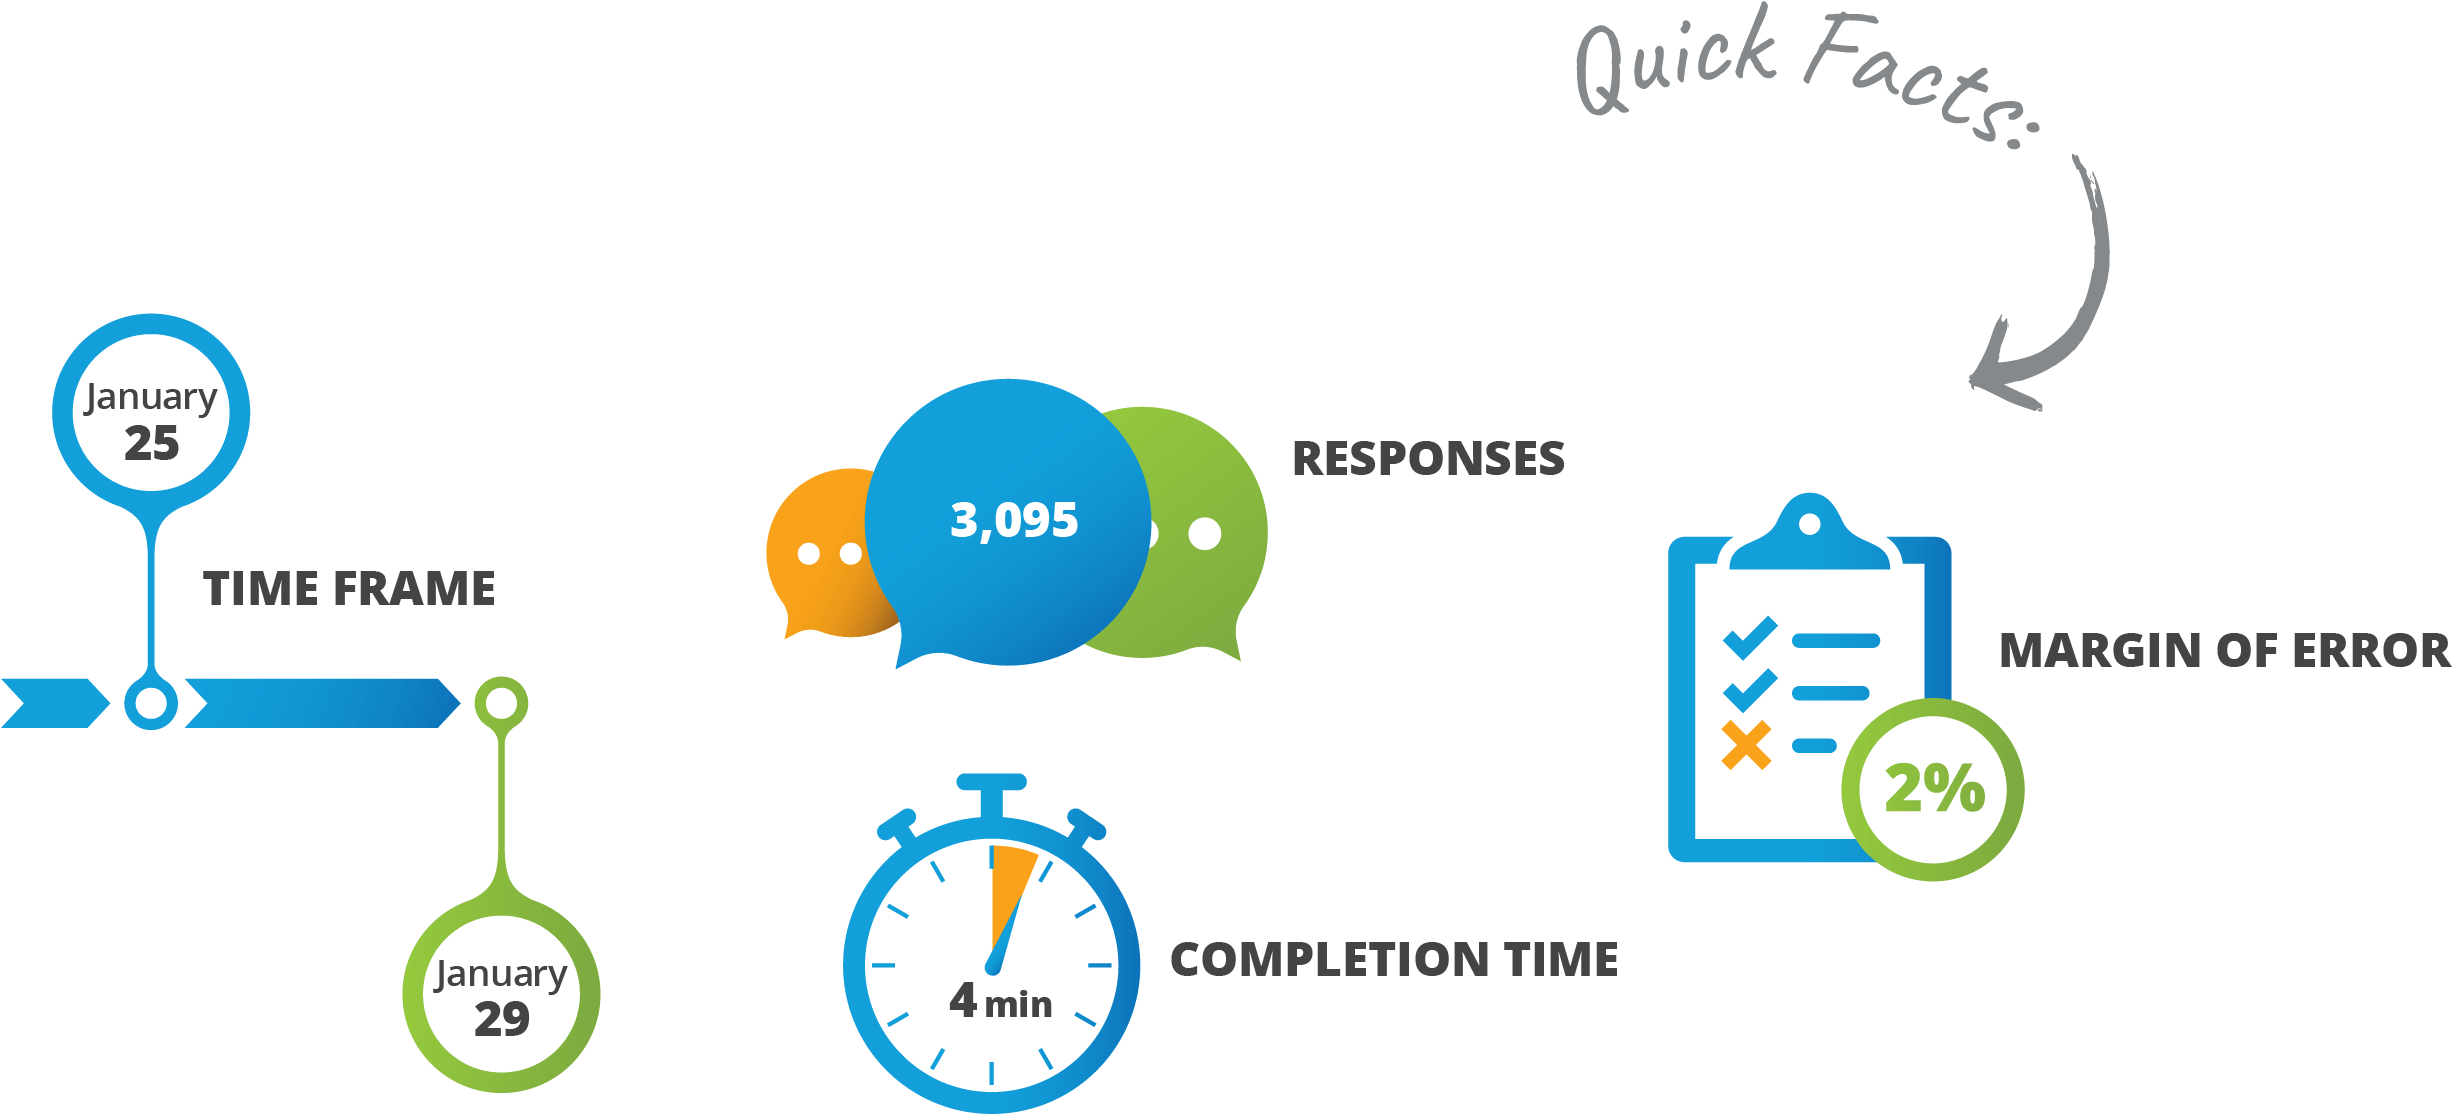
EZ Texting surveyed more than 3,000 U.S. consumers to determine their attitudes, behaviors, and preferences regarding text message marketing, and uncovered some surprising changes since last conducting this survey in 2021.
This latest survey’s findings clearly demonstrate that text marketing will continue to grow and further reinforces what we already knew — when you want your message seen, send a text.
Methodology
The 2022 Consumer Texting Behavior Report was conducted by EZ Texting to measure consumer attitudes, behaviors, and preferences with respect to text messaging.
The survey was conducted online through an independent market research panel provider in January 2022. The 3,095 participants, who remained anonymous, were qualified based on their location and ownership of a mobile phone for personal use.
The Rise of the Mobile-First Consumer
According to the Pew Research Center1 97% of Americans now own a cellphone of some kind, with 85% owning a smartphone. Since most phones come with native texting features, that means nearly everyone can receive a text. Considering a recent reviews.org2 survey, which found that 47%, nearly half of all Americans, feel “addicted” to their phones, perhaps it’s no surprise that our survey results found that 87% of consumers say their mobile device is usually or always within reach.

What does this mean for small businesses, organizations, and marketing teams? According to emarketer3, retail mcommerce — or shopping from a mobile device — has grown exponentially during the pandemic, reaching $359.32 billion in 2021 — an increase of 15.2% over 2020. By 2025, it’s predicted to account for $728.28 billion annually and 44.2% of all retail ecommerce sales in the U.S.
Text offers an easy, dynamic, and linear channel for reaching the mobile-first consumers driving these trends.

Text vs. Email — or a Custom Blend
Our survey results clearly reveal another trend: as consumer preference for text marketing continues to rise, email marketing’s popularity continues to fall, with year-over-year sentiment toward both channels experiencing dramatic changes. What does this signal? It signals that many consumers prefer a customized experience, which for some may include a blend of email and text marketing.
The survey results also demonstrate how businesses and organizations can use a customized combination of email and text marketing to complement each other to create marketing and communication strategies specific to each recipient’s unique preferences.

APPOINTMENT REMINDERS remain a wildly popular use for text marketing and are used by a wide array of businesses and organizations. This year’s survey showed that 75% of consumers now prefer to receive appointment reminders via text — a healthy 10% growth over 2021.
In fact, text as a preferred channel jumped by no less than 7% across all message types, with consumer preference for text delivery confirmations seeing the biggest increase, jumping 12% in one year. Text emergency notifications also scored high for consumers, with an increase of 8%, hitting 67%. SMS became the consumer-preferred method to receive payment reminders, which jumped 10% to 54% this year. Finally, the preference for order confirmations via text leapt 11% to hit 43%. The emerging trend of text as a preferred channel is not new and its growth and adoption trajectory are expected to continue.

Text and email come close to leveling off in two key categories: flash sale and customer support. While consumer preference for text messaging in the flash sale category jumped 8% to 41% this year, email’s lead in this category dropped 6% to 43%. Meanwhile, customer support represents email's biggest drop in consumer preference, slipping 11% to just 38%, versus text messaging’s 10% leap to 34%. We see both of these categories trending toward text marketing over the upcoming months.
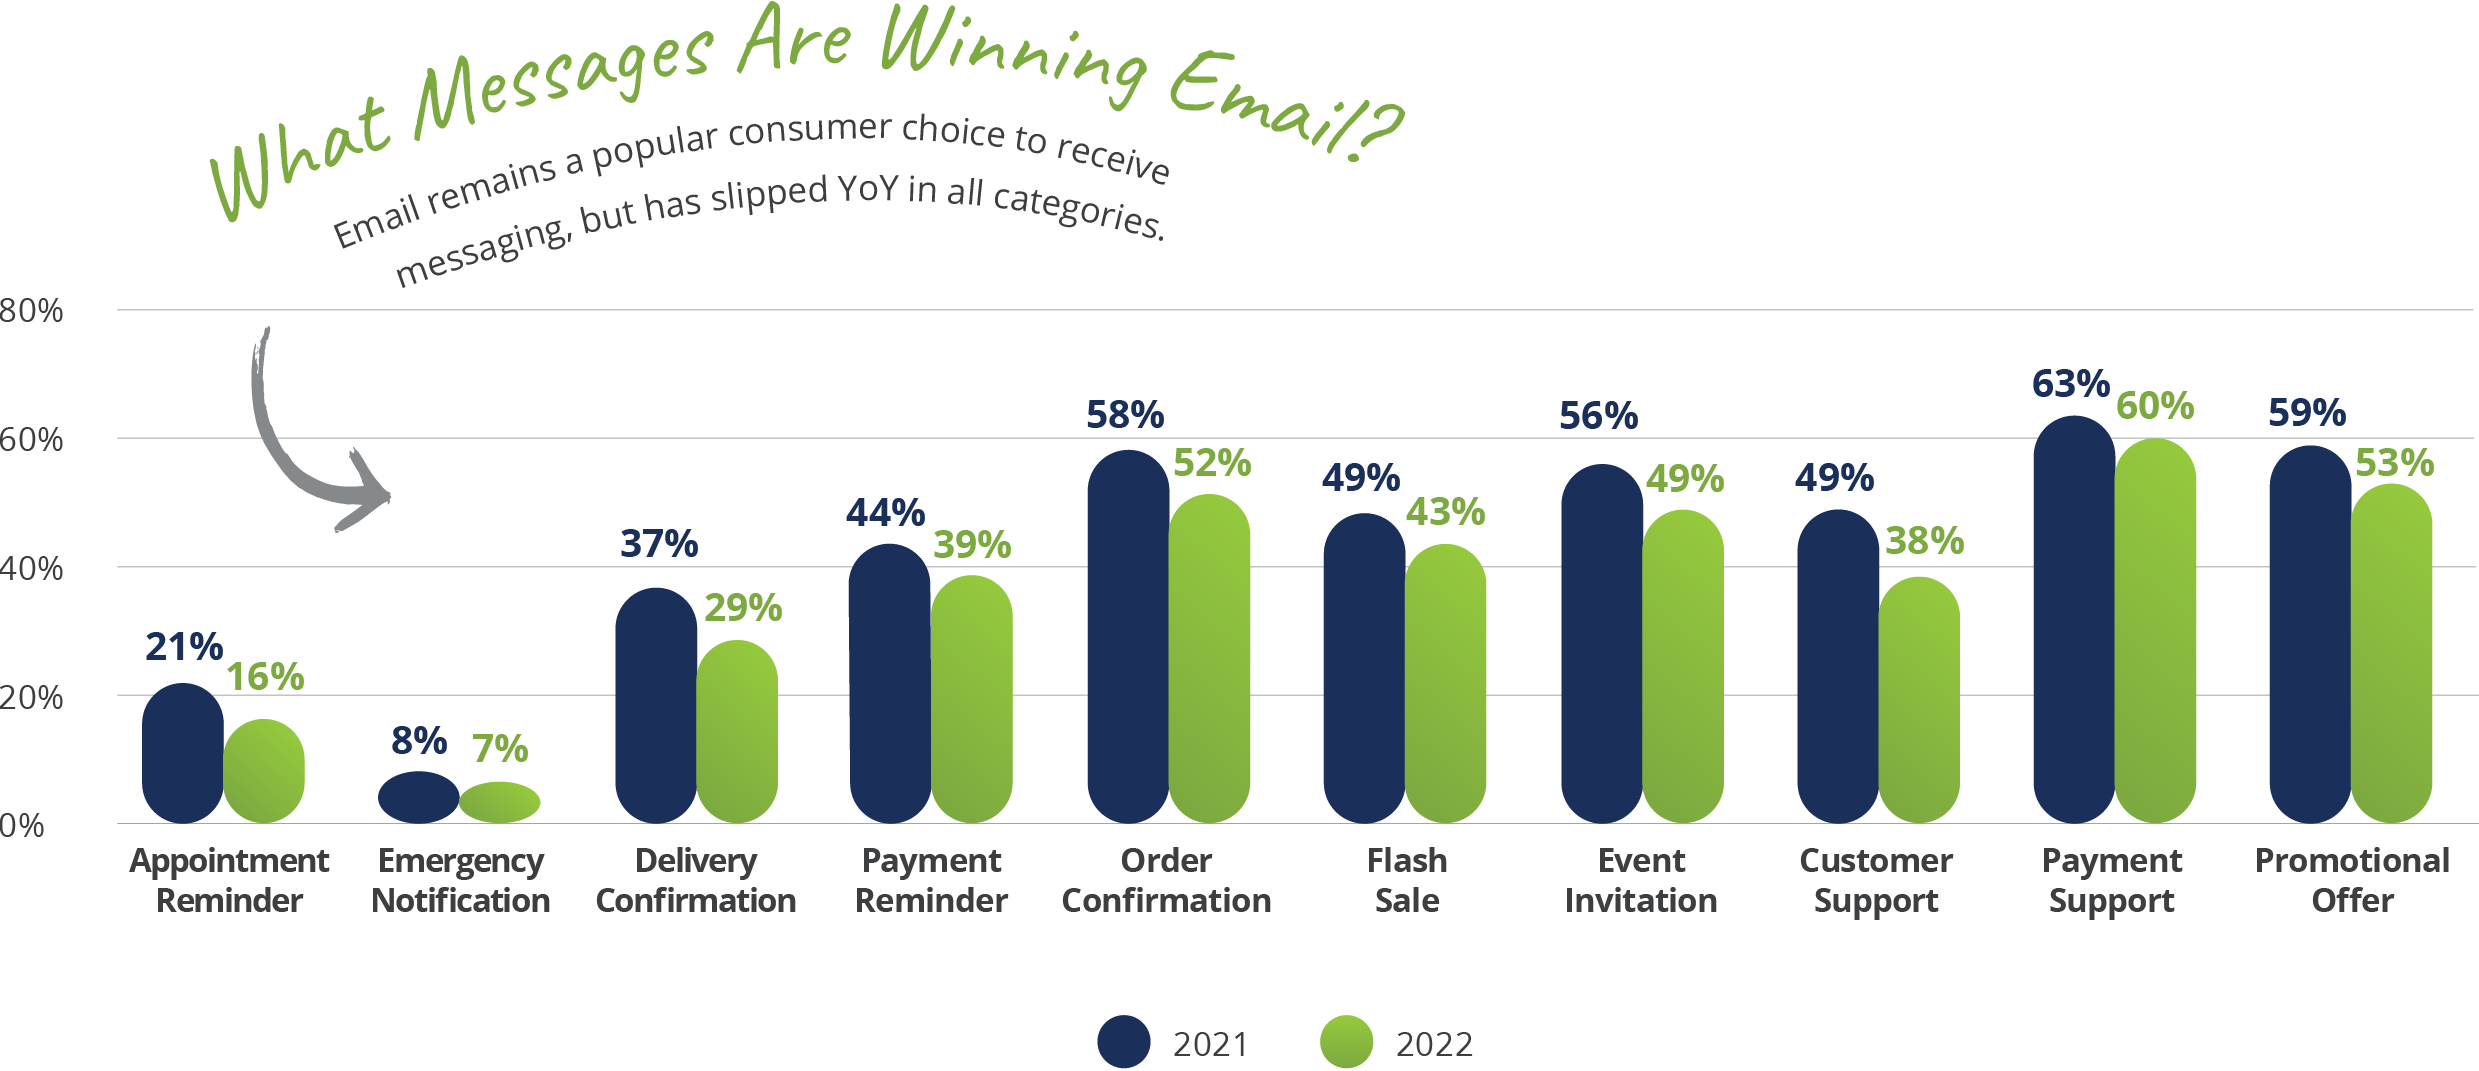
While email is still the preferred channel for payment support (60%), promotional offers (53%), order confirmations (52%), and event invitations (49%) it is important to note that there is a decline across each message type.


You can also see these trends in the daily volume of texts and emails that consumers regularly receive. A full 78% of respondents say they receive fewer than 1 or 2-5 text messages from businesses or organizations in a single day.

In comparison, as it’s channel dominance falters, email strategies have become unrestrained, leading to overstuffed inboxes and ignored messages.
Compare text and email side-by-side and you can clearly see that consumers receive far fewer text messages than emails, making text an ideal way to cut through the inbox clutter and ensure your customers see your messages.
No Channel Is Faster or More Convenient than Text
Throughout the many phases of the pandemic in 2022, we’ve seen the rise of convenience texting. Convenience texting includes things like curbside-pickup updates, delivery notifications, and alerts to notify people of changing health directives or policies. Marketing Insiders Group4 recently named convenience as one of five consumer behavior trends to watch, saying that “consumers will choose brands who offer multiple convenient service options.” An article published by Nielsen5 shouted: “COVID-19 elevated convenience to a new level, and that’s how it will stay.” That “new level” couples convenience with immediacy, especially when public health protocols and other day-to-day routines are often subject to last-minute changes.

When we asked consumers about the benefits of signing up for text messages from a business or organization, 56% told us that, “Texting is a convenient way to reach me no matter where I am” — nearly a 10% increase compared to last year’s results.
How Do Consumers Feel When They Get a New Text?
We all know that consumer attention is at a premium these days, which makes it all the more exciting to find out that a new text message makes 64% of consumers feel one thing above all else — curious!
Consumers who feel curious when they receive a new text are up 3% from when we ran this survey last year, but consumers who feel happy rose 5% as the second most popular response.

When you combine text messaging’s immediacy, convenience, and personalization features with high-value messages, eye-catching promotions, and perks like membership rewards — you are left with a tool that has endless possibilities for delighting customers.
Why does delighting customers matter? Happy consumers buy more, join more, and are more likely to engage with your messaging to help build your brand. And according to Forrester6, the coming year will show that, “demand for brands that deliver instant happiness and comfort will propel category growth.”
Getting the Timing & the Frequency Right
Now that customer preferences for message types and how consumers feel when they receive a new text is clear, let’s take a look at some survey results that speak to timing. How can we identify messaging windows that will reach the widest audiences and target those select times?
WHEN DO CONSUMERS PREFER TO RECEIVE A TEXT?
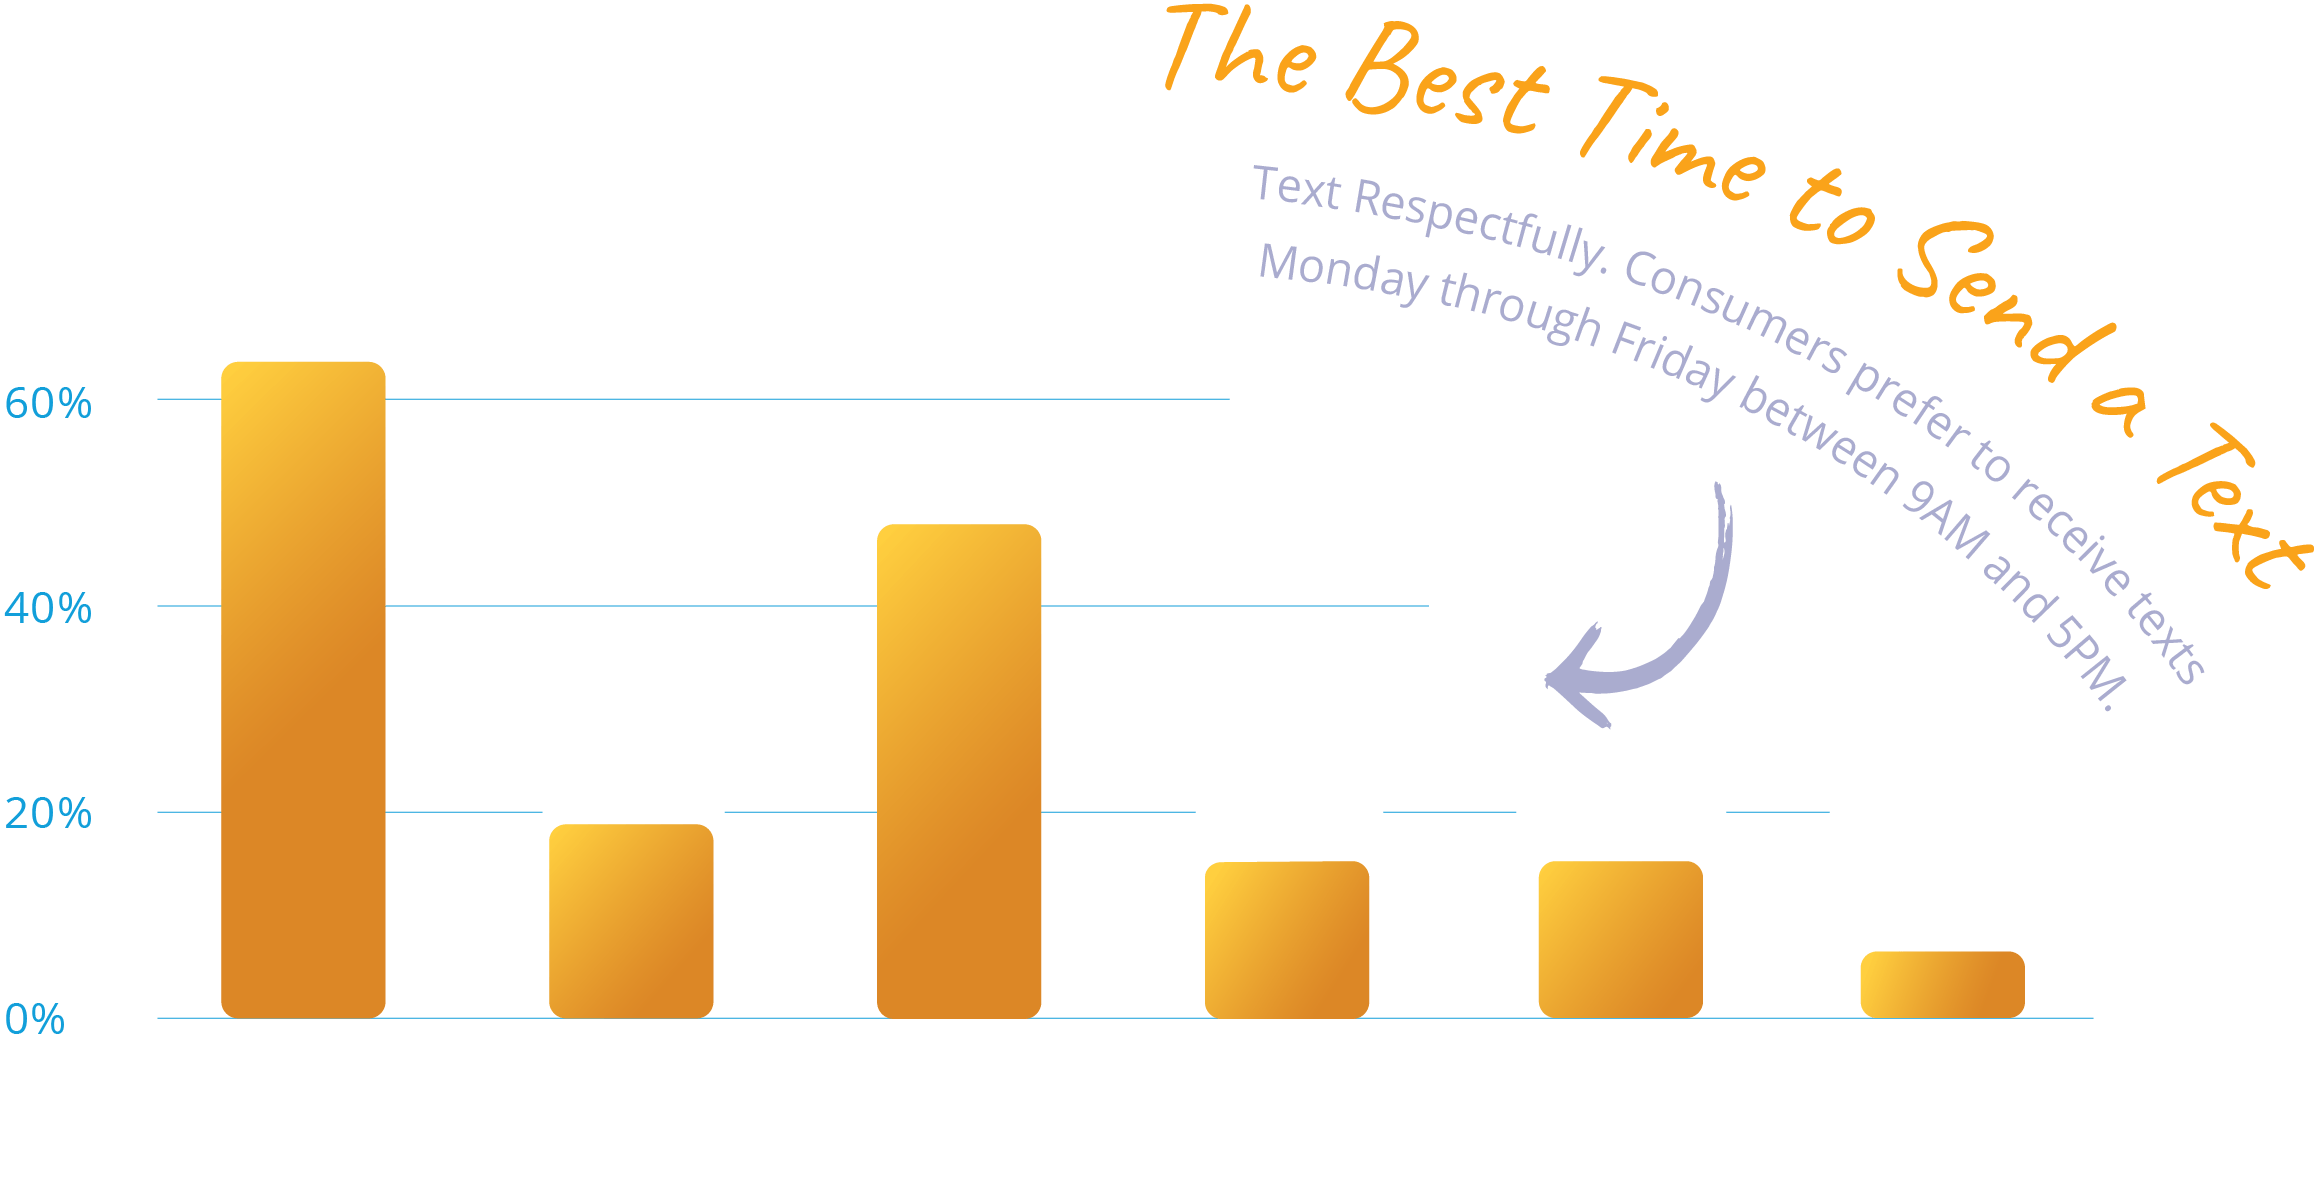
This one’s easy. The majority of consumers prefer to receive texts from a business or organization Monday-Friday, 9AM-5PM or during the hours that are typical to the particular business.
When strategizing your When, use regular business hours as a starting point. These windows of time are not only when your customers want to receive a text message, they are also the times when you will experience higher engagement levels.
To measure how effective your timing is for your specific customer base, review response rates and unsubscribes to see if you’re on the right track. If you are noticing low response rates or high unsubscribe rates, try a different time frame while remaining within business hours.
HOW MANY TEXTS ARE TOO MANY?
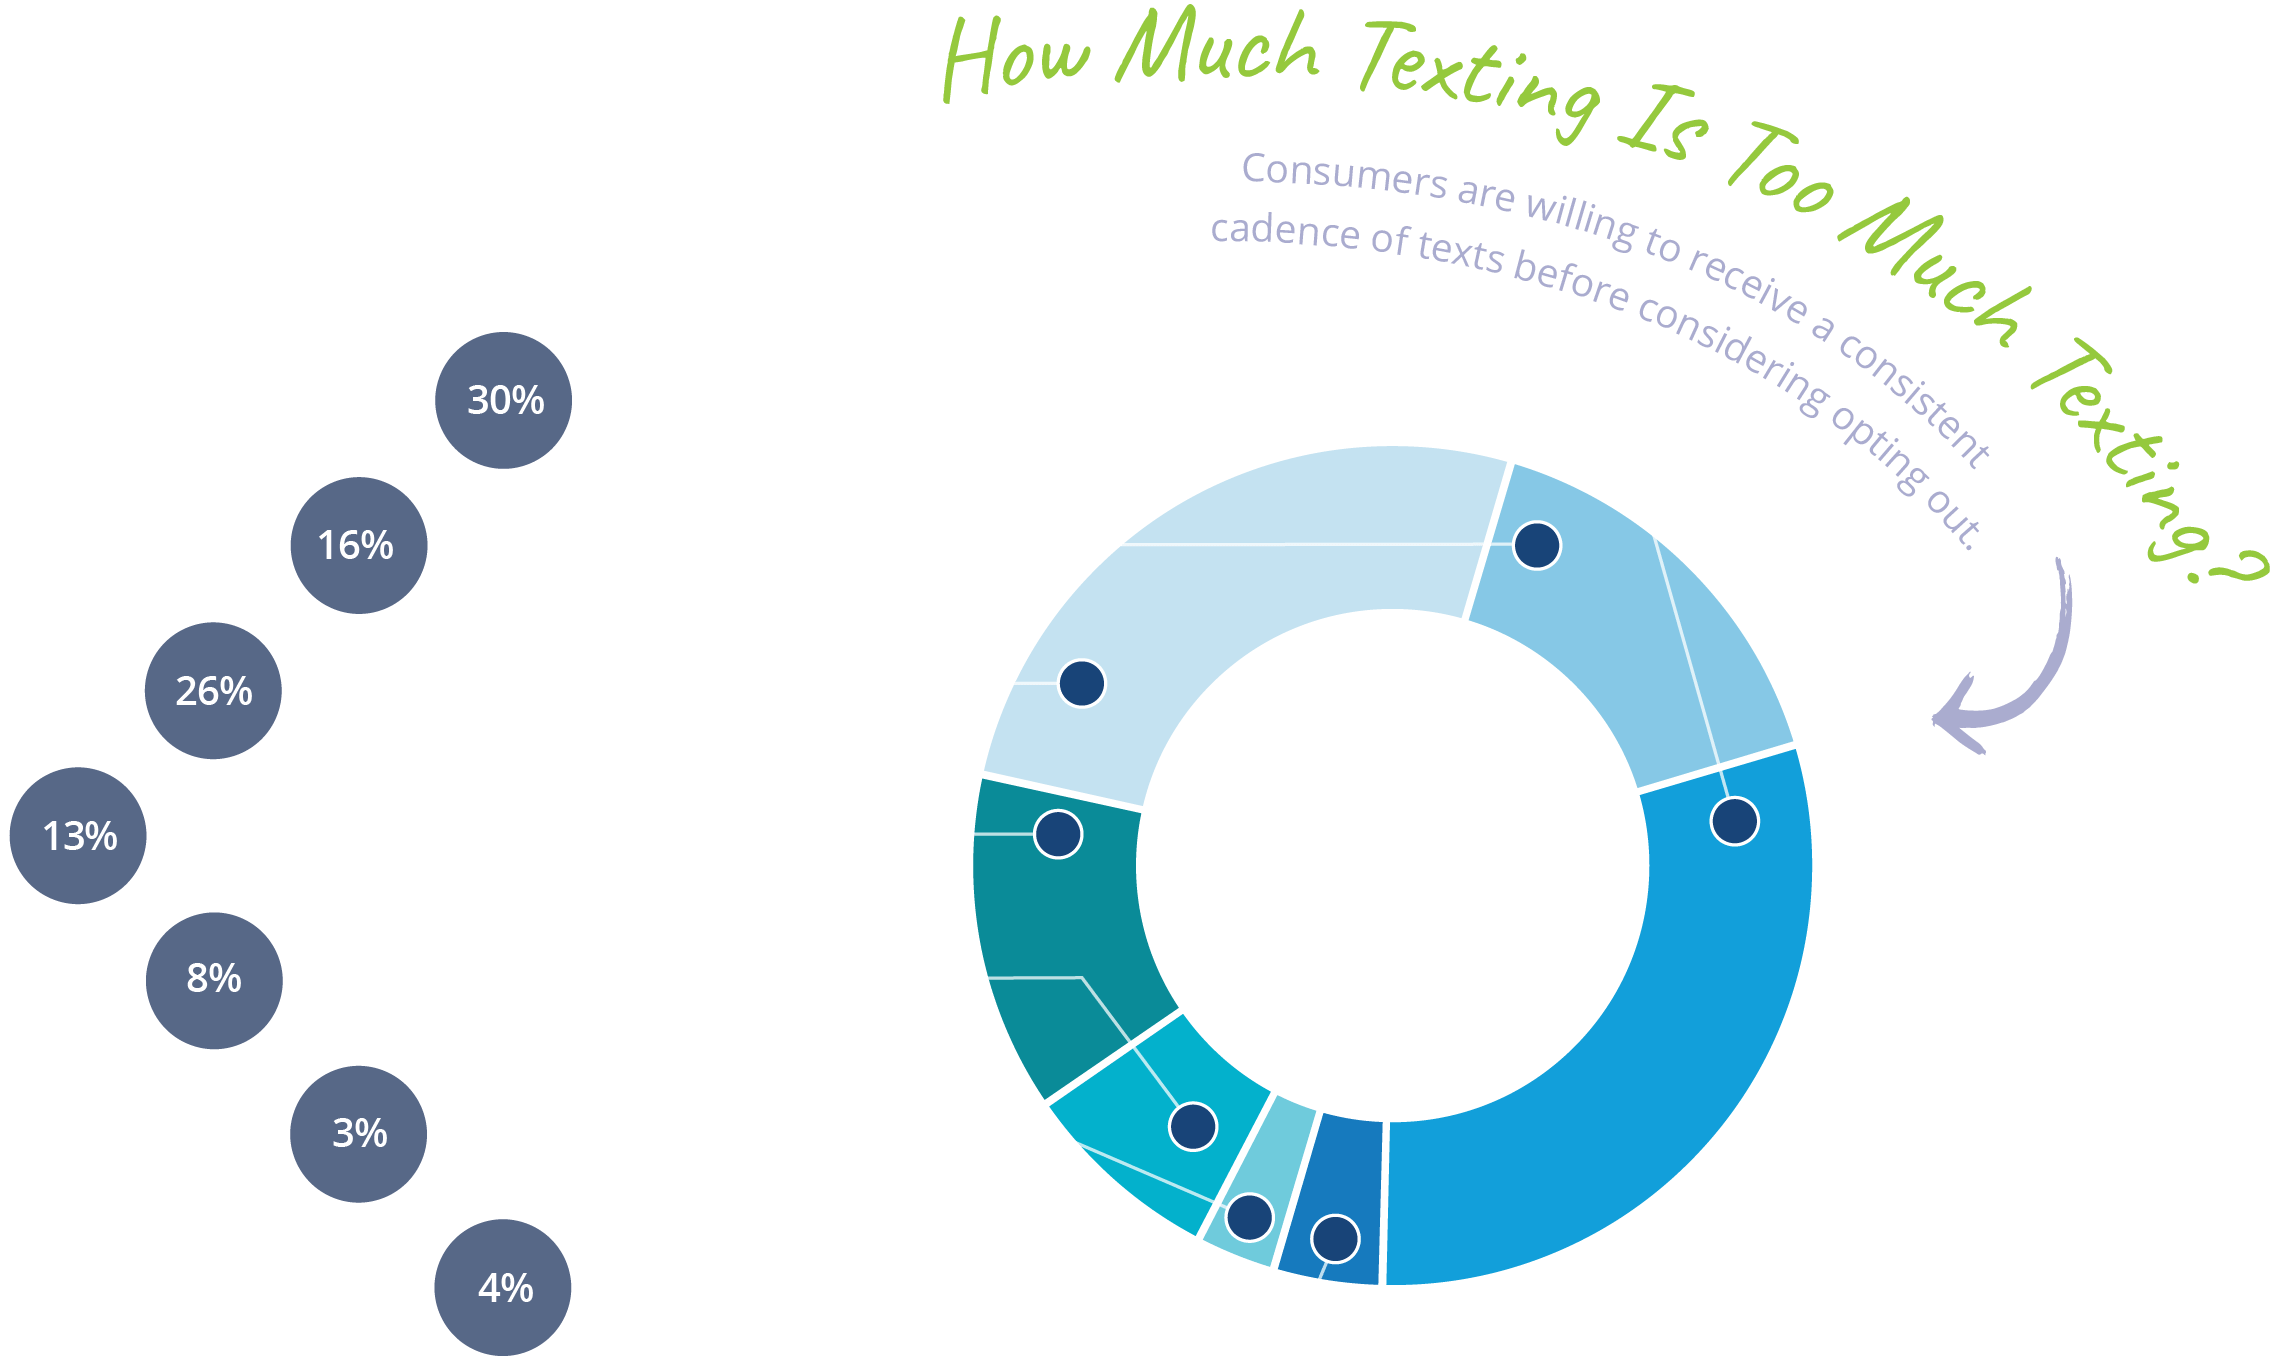
We asked survey respondents, “How frequently could an organization text you before you would consider opting out?” The majority (30%) said, “More than once a day,” with a near-equal amount (26%) saying, “A few times a week.”
If you’re new to text marketing, it’s best to start by sending no more than one text per week. This should keep you in good standing with 85% of consumers.
If you feel you have more than one important, high-value message to communicate to your contacts every week, feel free to bump it up to two texts per week and 72% of those surveyed say you’ll stay on their good side.
Understanding Unsubscribes
Let’s face it — unsubscribes happen. It’s how you react to opt-out information that can separate you from the competition. When one of your customers or members opts out of your text list, they’re doing it for a reason. Knowing why customers choose to opt out can help you pivot your messaging strategies and maximize text retention. So, we asked survey respondents to share what motivates them to unsubscribe.
Below we’ve compiled a list of the top reasons why consumers unsubscribe from text lists, along with guidance on how to respond to each situation.
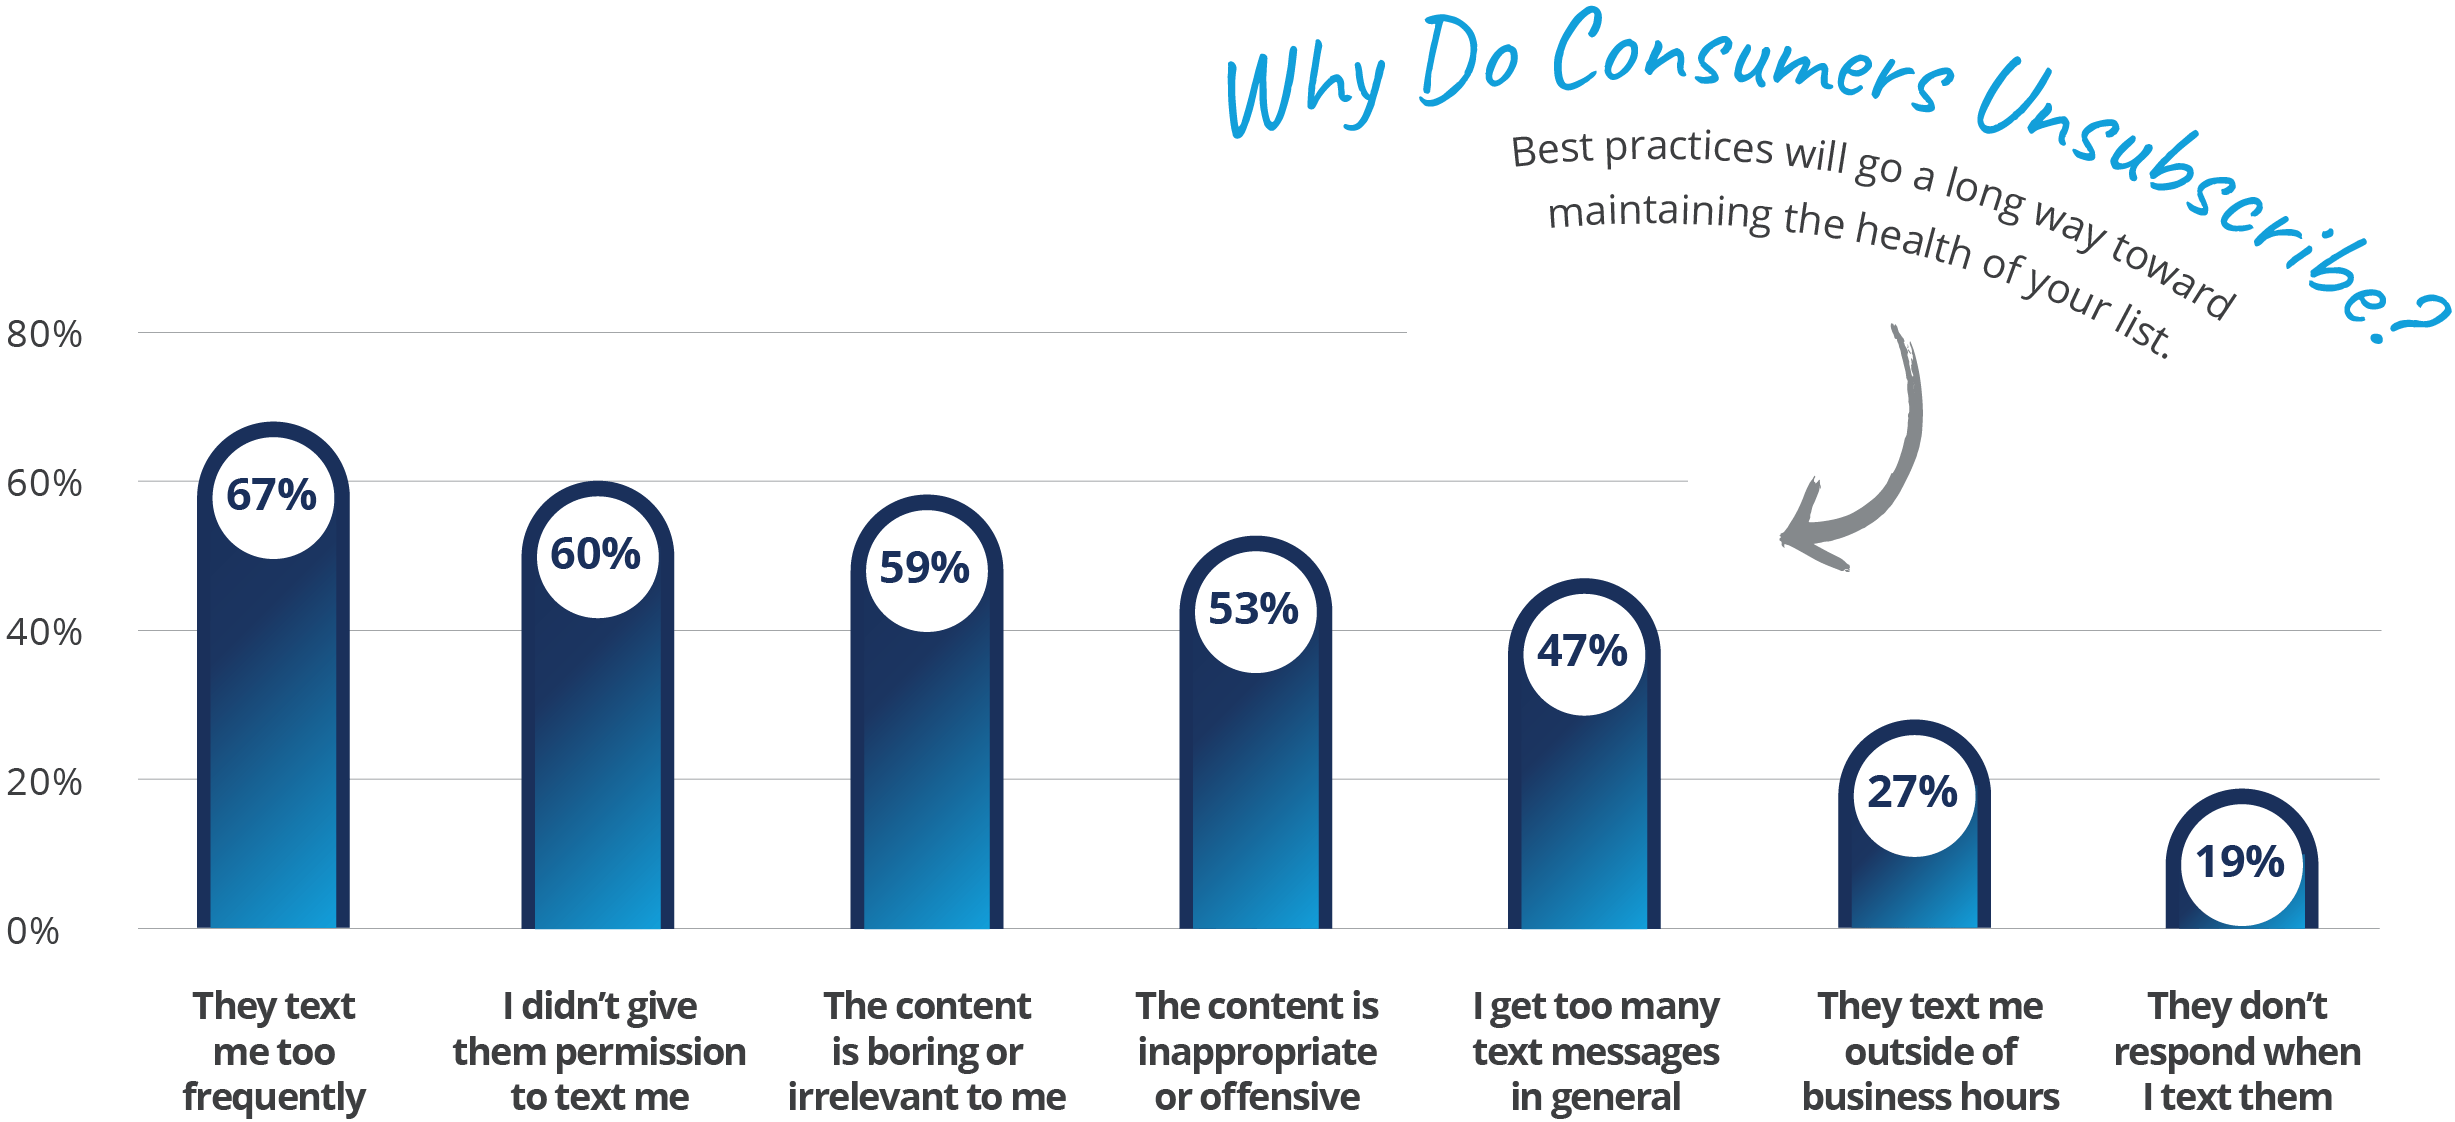

“THEY TEXT ME TOO FREQUENTLY.”
As we’ve shown, consumers overwhelmingly prefer to receive texts from a business or organization during the traditional business hours of 9am-5pm during the weekdays.
What is less clear is how frequently consumers would like to receive text messages during those hours. Too many texts can result in opt outs, so how do you know where to begin?
Luckily, this is something you can easily test, and your unsubscribe data can help. First, establish a baseline, perhaps one message per week. After a month or two of messages, try sending two per week and see if your unsubscribe rates change. If they do, your audience may not want to receive two messages per week from your business.

“I DIDN'T GIVE THEM PERMISSION TO TEXT ME.”
Compliance is incredibly important in the world of text marketing. Just like email, it is a permission-based activity, meaning that you must receive permission from each contact in your list before you begin sending them messages.
Many text platforms will offer tools to help you grow your compliant opt-in list quickly and easily.

“THE CONTENT IS BORING OR IRRELEVANT TO ME.”
Text marketing is as close as you can get to your customers without being face-to-face, and because people feel so personally connected to their mobile devices, it’s best practice to approach it as a high-value channel. In other words, only send the types of communications your contacts consider especially important or valuable. This may include everything from the convenience texts (appointment reminders and notifications) consumers love to receive, to your most highest-value promotions, coupons, and exclusive offers.
You can primarily thank the rise of political texting for the 53% of consumers who say they would unsubscribe because, “The content is inappropriate or offensive.” And the 27% of consumers who say, “They text me outside of business hours” only goes to support the importance of perfecting your messaging window.
And there’s one more result worth mentioning…

“THEY DON'T RESPOND WHEN I TEXT THEM.”
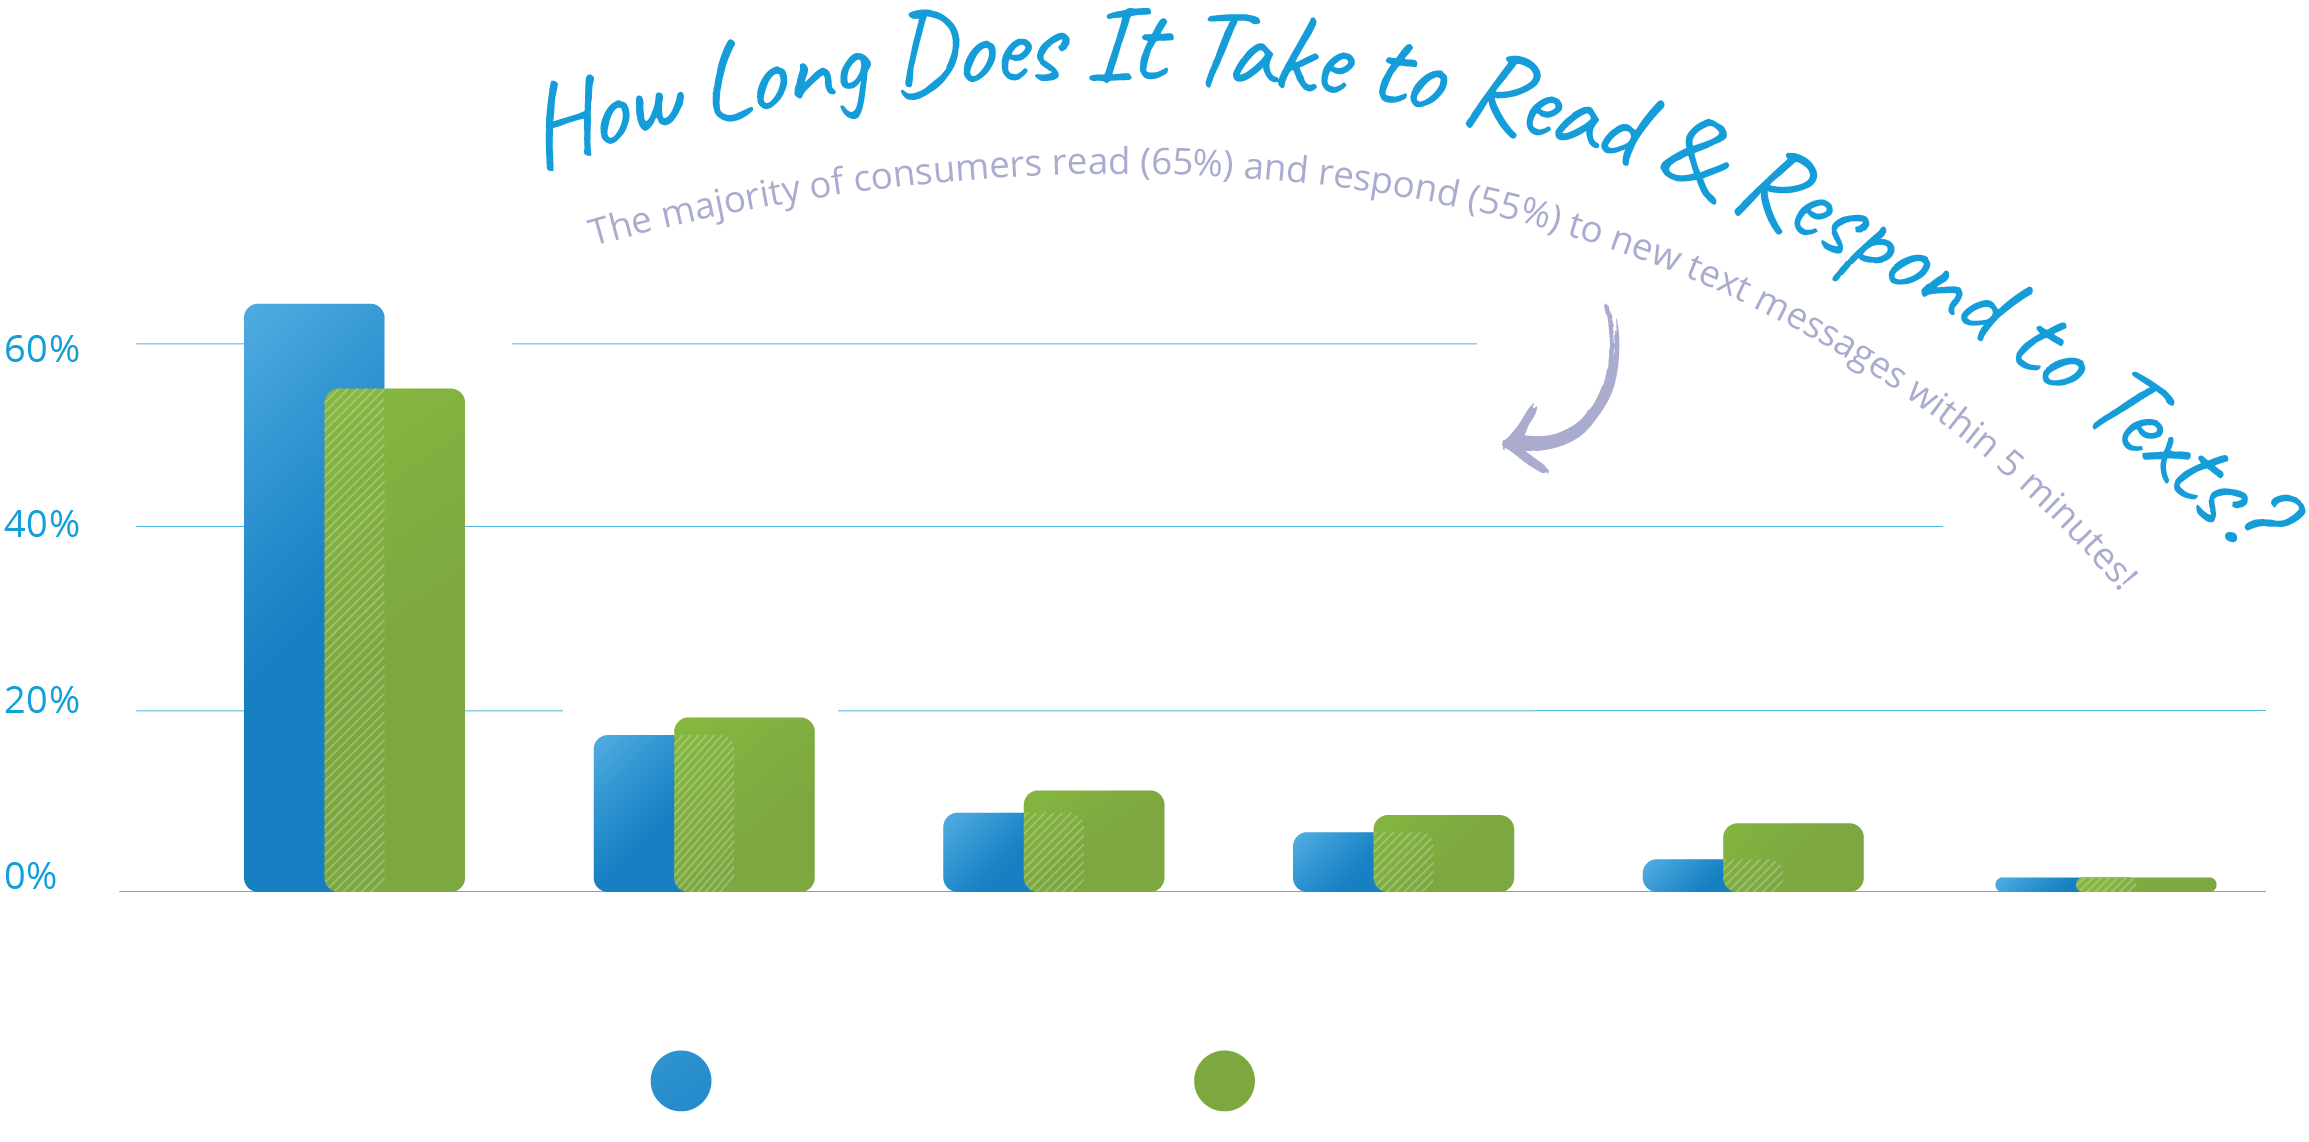
Unlike email, consumers view text as a two-way street. Not only do your customers and members want to receive texts, they also want to be able to reach you via text. When they initiate a text, customers want you to respond.
Consumers want to feel like they’re a part of the conversation and text allows you to have direct, one-to-one conversations with anyone texting your number or responding to a mass text message you’ve sent. It is important to respond to any consumer texts in a timely manner to show that you also view text messaging as a means to interact.
Because customers view texting as an opportunity to have a conversation, text marketing can help you to reimagine your customer support capabilities, boost engagement, grow sales, and build your brand — all at the same time.
Conclusion
When comparing email and text marketing and outbound calling channels, year-over-year, texting provides a faster, more immediate way to reach all your contacts at once.
1 https://www.pewresearch.org/internet/fact-sheet/mobile/
2 https://www.reviews.org/mobile/cell-phone-addiction/
3 https://www.businessinsider.com/mobile-commerce-shopping-trends-stats
4 https://marketinginsidergroup.com/content-marketing/5-consumer-behavior-trends-marketers-are-watching-in-2021/
5 https://www.nielsen.com/us/en/insights/article/2021/covid-19-elevated-convenience-to-a-new-level-and-thats-how-it-will-stay/
6 https://www.forrester.com/blogs/predictions-2022-consumer-behavior/
